# How to generate a pie chart of event types in Cloudwatch
Today I learned how to generate a pie chart of event types in Cloudwatch. This charts helps us see which event types happen the most frequently.
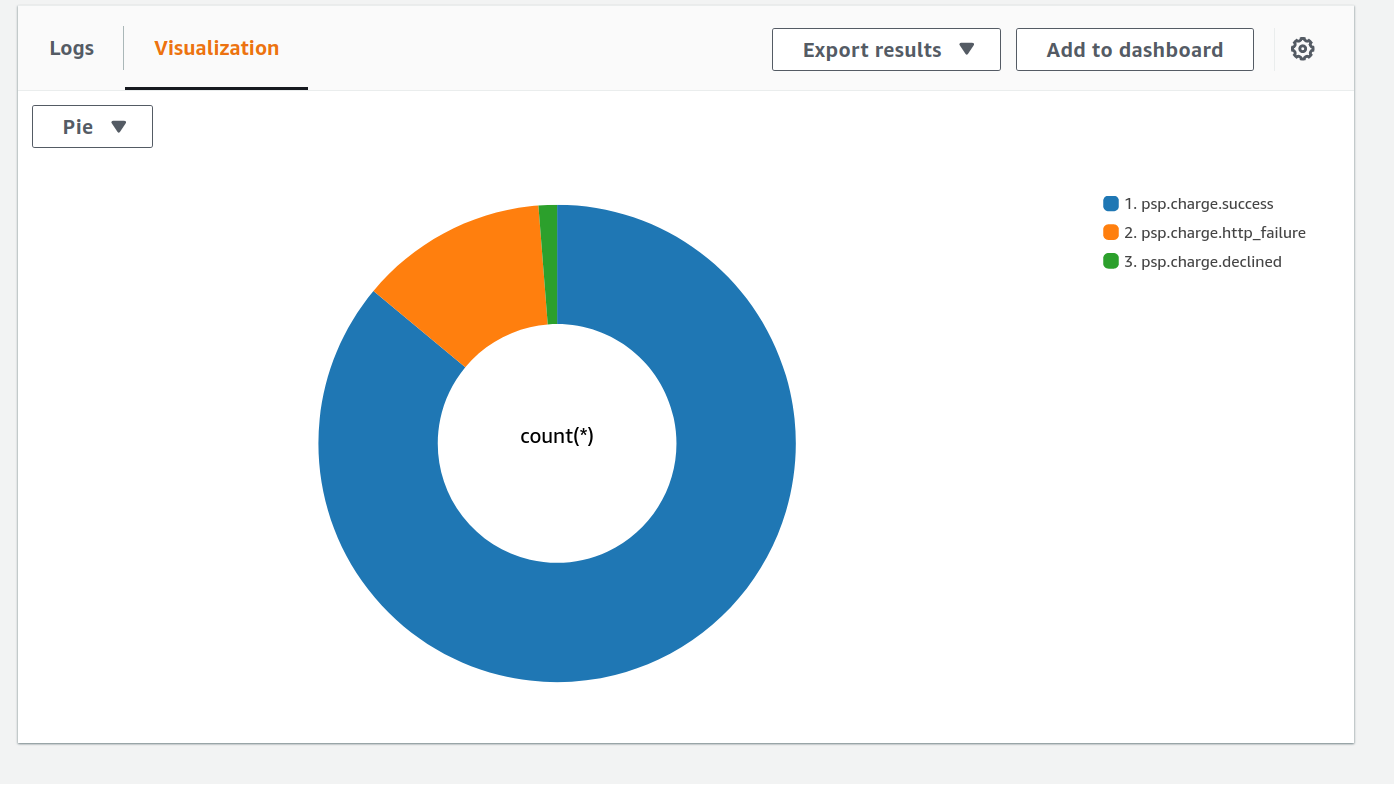
We log some events that start with psp.charge and end with the outcome of the charge, e.g. .success, .http_failure or .declined.
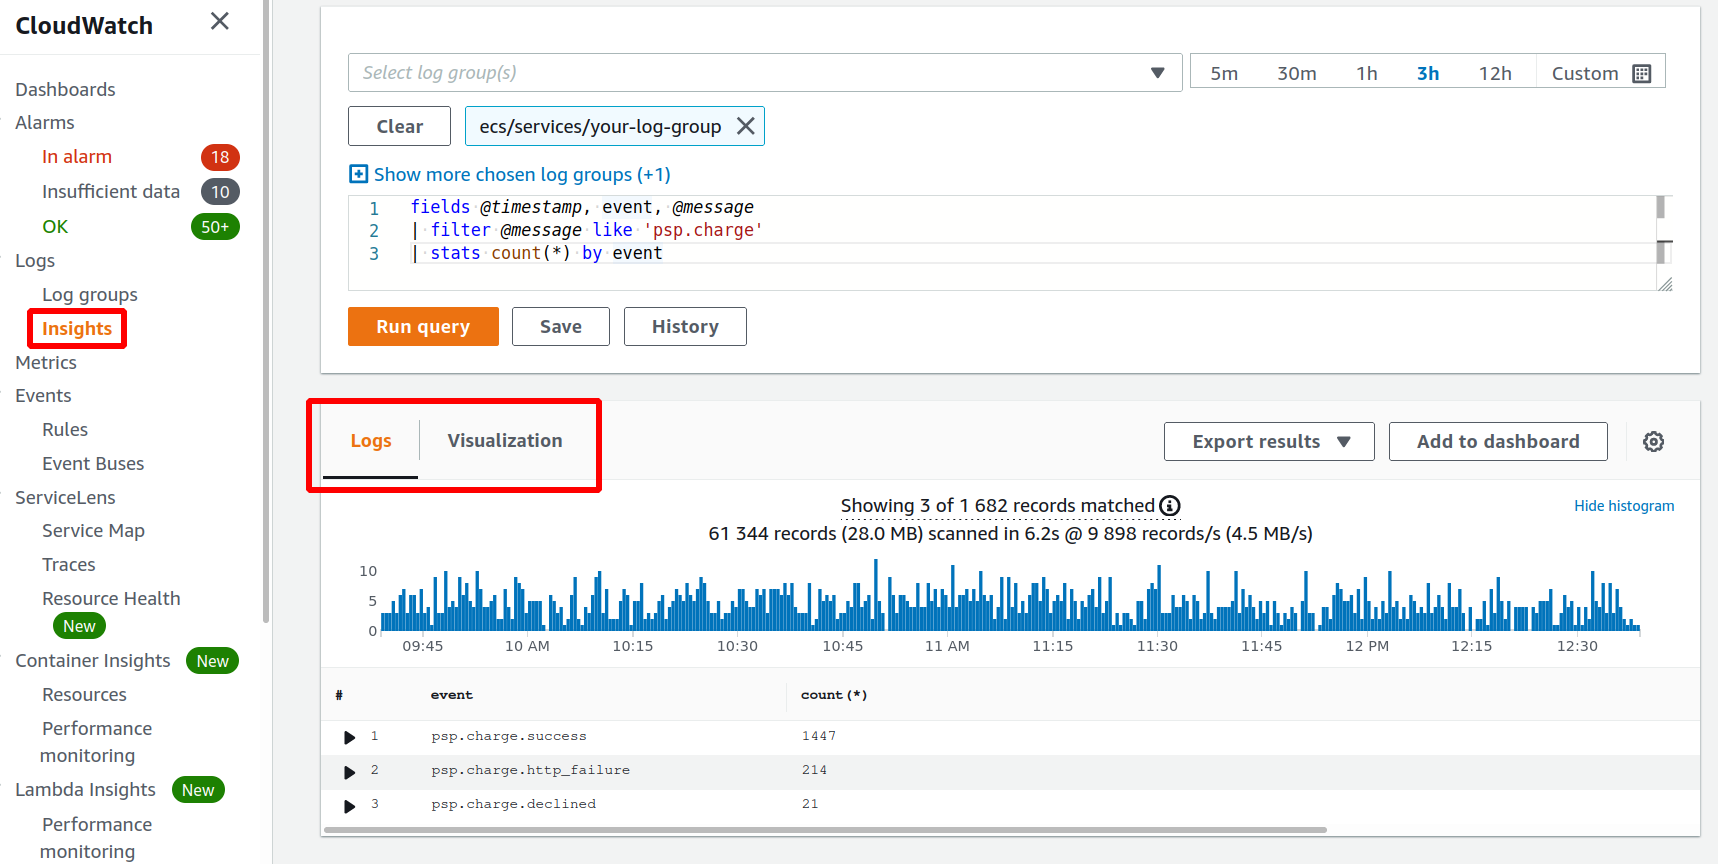
We can filter our Cloudwatch logs in Cloudwatch insights for events that start with psp.charge and group them by event type with this query:
fields @timestamp, event, @message
| filter @message like 'judopay.charge'
| stats count(*) by event
2
3
After waiting for the query to execute, we'll see the "Logs" result containing the respective counts of the events:
And on the "Visualization" tab, we can see the pie chart shown above.
Thank you for reading my blog! If you enjoyed this post, you're welcome to subscribe via RSS here (opens new window) (I can recommend NetNewsWire on iOS).