# How to draw vertical lines on a Datadog graph
Thu Mar 10 2022
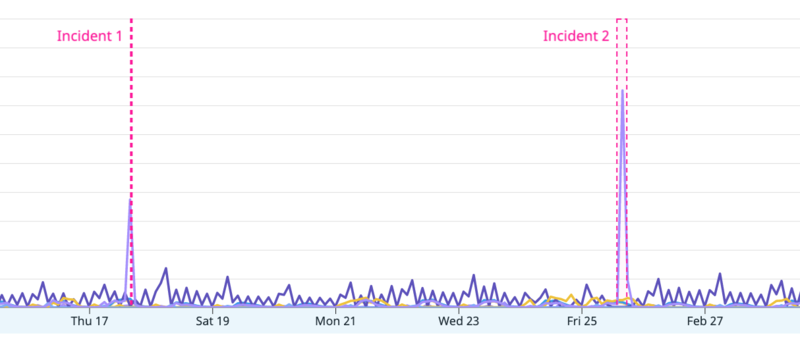
It's possible to draw vertical lines/range on a Datadog graph like this:
- Open the JSON (opens new window) tab of your graph:
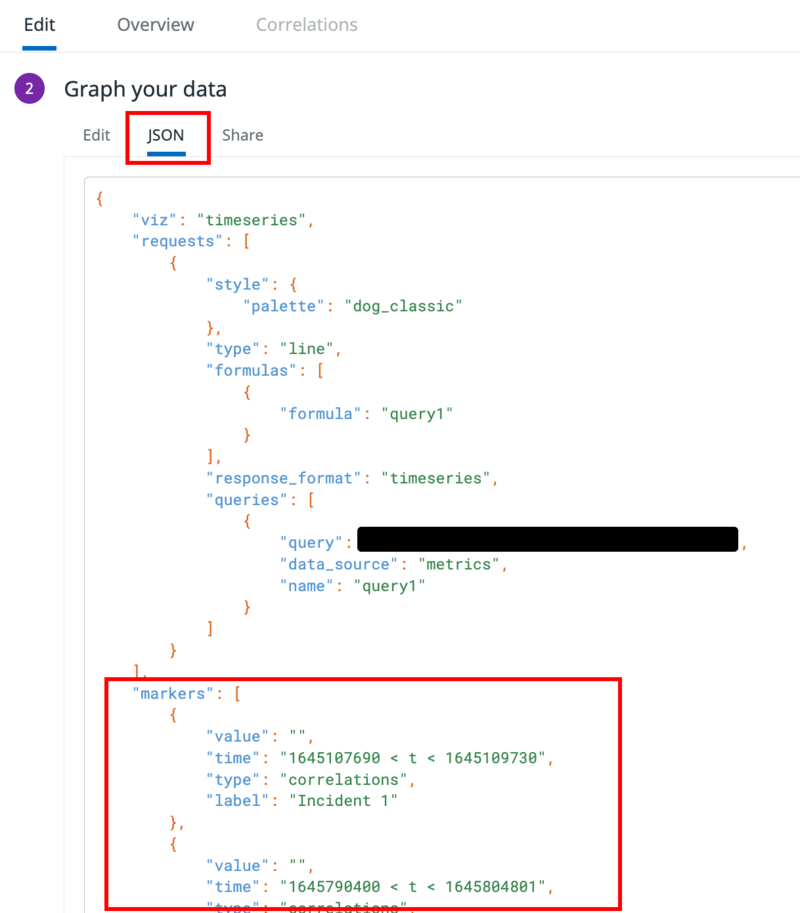
- Add or update the
"markers"field of your graph's JSON data and add new markers with the following format:
    "markers": [
        {
            "value": "",
            "time": "1645107690 < t < 1645109730",
            "type": "correlations",
            "label": "Incident 1"
        },
        {
            "value": "",
            "time": "1645790400 < t < 1645804801",
            "type": "correlations",
            "label": "Incident 2"
        }
    ]
1
2
3
4
5
6
7
8
9
10
11
12
13
14
2
3
4
5
6
7
8
9
10
11
12
13
14
- The time range needs to be in seconds since the Unix Epoch. You can use this handy website (opens new window) to convert between human-readable dates and seconds.
Thank you for reading my blog! If you enjoyed this post, you're welcome to subscribe via RSS here (opens new window) (I can recommend NetNewsWire on iOS).